Tuesday, 18 June 2019

Classification-Logistic Regression


  LOGISTIC REGRESSION


Logistic Regression is a Machine Learning classification algorithm that is used to predict the probability of a categorical dependent variable. In logistic regression, the dependent variable is a binary variable that contains data coded as 1 (yes) or 0(no).It is a special case of linear regression where the target variable is categorical in nature. It uses a log of odds as the dependent variable.

Linear Regression Equation:

 y= b0 + b1X1 +b2X2 +......bnXn

Where, y is dependent variable and X1, X2 ... and Xn are explanatory variables.
Sigmoid Function:
                                               p=1/1+e-y

Apply Sigmoid function on linear regression:
                                  
    p=1/1+e-(b0 + b1X1 + b2X2……bnXn) 

In order to map predicted values to probabilities, we use the sigmoid function. The function maps any real value into another value between 0 and 1. In machine learning, we use sigmoid to map predictions to probabilities.

Image result for sigmoid function in logistic regression

 Deciding  the boundary:

Our current prediction function returns a probability score between 0 and 1. In order to map this to a discrete class (true/false), we select a threshold value  above which we will classify values into class 1 and below which we classify values into class 2.
p≥0.5,class=1
p<0.5,class=0

For example, if our threshold was .5 and our prediction function returned 0.7, we would classify this observation as positive. If our prediction was 0.2 we would classify the observation as negative. For logistic regression with multiple classes we could select the class with the highest predicted probability.


Building logistic regression in python

To build Logistic regression we consider the following dataset

The dataset contains information of users of a social site.It contains user_id ,gender, age, salary.It has several business clients who can display their advertisement on the social site. One of the clients is a car company who has just launched a luxury SUV for very high price.We will be trying to see which user is going to buy SUV.We are going to build a model which can predict whether the user can buy the luxury SUV.

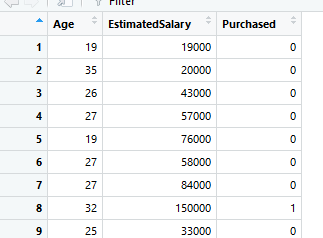
Step1: Importing the dataset:


Output:

The dataset consists of following columns from which the prediction is based on only two variables  Age and Estimated salary.We will find correlations between Age and salary and the decision to purchase.We are excluding other variables for simplicity in visualization.


Step 2:Splitting the dataset into training set and test set


Step 3:Applying Feature scaling  to the dataset:


Step 4:Fitting logistic regression model in training set and predicting the test set results

Step 5:Generate confusion matrix.


A confusion matrix is a summary of prediction results on a classification problem.The number of correct and incorrect predictions are summarized with count values.It allows easy identification of confusion between classes e.g. one class is commonly mislabeled as the other.
It gives us insight not only into the errors being made by a classifier but more importantly the types of errors that are being made.

Step5: Visualizing the training set results


Output:

Step6: Visualizing test set results


Output:
As seen in the above two graphs of training set and test set,the graph tells us about the users who bought SUV or not.The red users(dots) denotes users who didn't purchase SUV and green users who purchased SUV.Each user is characterized by its age and estimated salary.However in the graphs there are some predictions which turn out to be wrong i.e the green dots on the red region and vice-versa.This amount of incorrect is bound to happen and the number of incorrect and correct predictions can also be identified by confusion matrix.
So, main goal of building this model is classifying the right users into right category.The line between the two classes is the best fit classifier for this model.


Thanks for reading!!!


Wednesday, 12 June 2019

Polynomial regression


 POLYNOMIAL REGRESSION


Linear regression is the relation between the dependent variable and the independent variable to be linear. If the distribution of the data becomes more complex then the linear line won't best fit in the data. So for the line or a curve to best fit the data we use polynomial regression.How can we generate a curve that best captures the data?


The basic goal of regression analysis is to model the expected value of a dependent variable y in terms of the value of an independent variable x. In simple regression, we used following equation 
                     
                    y=a + bx

Here y is dependent variable, a is y intercept, b is the slope.
In many cases, this linear model will not work out.The predicted results sometimes generate a value which is far from actual values which can lead to wrong information being conveyed.In such cases we use the following equation
   y= a + b1x + b2x^2 +....+ bnx^n


Polynomial regression is a form of regression analysis in which the relationship between the independent variable x and the dependent variable y is modelled as an nth degree polynomial in x
.
Notice that Polynomial Regression is very similar to Multiple LinearRegression, but consider at the same time instead of the different variables the same one X1, but in different powers; so basically we are using 1 variable to different powers of the same original variable.

For example:Consider that there is a  human resource team working for a big company and about to hire a new employee in this company.So the new employee seems to be a good fit for this job and now its time to negotiate about his new salary  for this job.The employee is asking a salary  to be above 160k  annual salary since he has  20+ years of experience and his annual salary was 160k in his previous company. However there is someone in the hr team who wants to know whether the details mentioned by the employee are true or not and that is why the HR retrieves the records of the previous company of different positions.With the help of applying polynomial regression to the above dataset one can find out by building a bluffing detecter to predict whether the analysis leads to truth or bluff i.e whether the new employee had mentioned the correct salary or not. 

To understand polynomial regression,lets generate dataset:


Fitting Linear regression to the dataset:


To implement this in Python we are going to create a LR model first from sklearn.linearmodel and call our object lin_reg


Fit polynomial regression to the dataset:


In this object we are going to call poly_reg that will be our transforming tool which will transform our matrix X in a new polynomial matrix where we can specify the degree we want to run our model with:


Visualizing linear regression results:


We can see that the straight line is unable to capture the patterns in the data.The line signifies the predicted values and the data points are the actual values.The line doesn’t best fits the data and there is huge difference between the actual salaries and predicted which can give a wrong information to the HR.To overcome this we fit a polynomial regression model.

Visualizing Polynomial regression results:


It is quite clear from the plot that the quadratic curve is able to fit the data better than the linear line.The curve best fits the data and the error between the predicted curve and actual curve has decreased which will help  the HR to get correct information about the new employee salary which is approximately equal to 160k annual salary and hance the mentioned details by the employee is correct.


Thanks for Reading!